
With a spectrum analysis we determine the composition of a metal such as steel. For this we create a sample from the material and test it in our in-house laboratory. If we check series for you, we will take over the transport for you at no extra charge.
We analyze and document the data digitally and create a comprehensive test report. We then send the finished test report by post or email to you.
The performance of the spectrum analysis is company-specific accredited and the evaluation is material-specific standardized.
Our services at a glance
- OES – spectral analysis of steels and cast materials
- OES – Spectral analysis of copper alloys
- OES – Spectral analysis of alloyed aluminum materials
- free transport on trains
- sample production
- sample archiving
- documentation
Spectral analysis explained briefly
First, create cylindrical samples of the material. Now the surface of the created samples is ground very fine. This eliminates impurities and increases measurement accuracy.
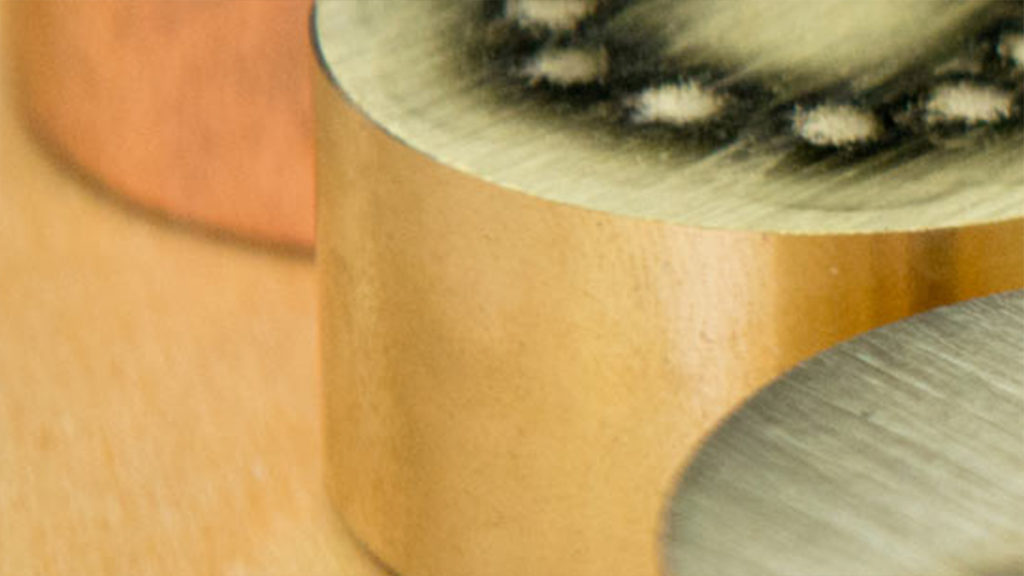
Subsequently, the analysis (Optical Emission Spectrometry OES) is carried out and the chemical composition is determined by means of optical emission of the alloy. During the test, a small part of the sample surface is burned and evaporated.
The alloy components dissolved in the vapor have a specific wavelength. The wavelength is measured, evaluated and the alloy determined.
How does optical emission spectrometry (OES) work?
Spectral analysis requires an electrical source to vaporize the material and excite the atoms. This is how atoms are able to emit their characteristic light or optical emission. A small part of the sample is heated to several thousand degrees Celsius. This is done by an electrical high voltage source in the spectrometer and a discharge via an electrode. The different electrical potential between the sample and the electrode creates an electrical discharge. The discharge takes place on the sample surface. The material on the surface is heated and evaporated, thereby stimulating the atoms in the material. The arc discharge resembles a flash; d. H. The discharge arc is kept constant over the duration of the measurement time.
The light thus generated, ie the optical emission lines of the evaporations on the sample, also called plasma, enter the spectrometer. A so-called diffraction grating splits the incident light into element-specific wavelengths and the associated detectors measure the light intensity for each wavelength. The measured intensity is proportional to the concentration of the corresponding element in the sample.
A computer system reads the measured intensities and processes these data using predefined calibrations to output element concentrations.
Accredited for Optical Emission Spectrometry (OES)
AA T13 Rev. 2 Optical emission spectrometry (OES) of 19 elements in steel and ferrous materials and 13 elements in Al materials
Feedback geben
Verlauf
Gespeichert
Community